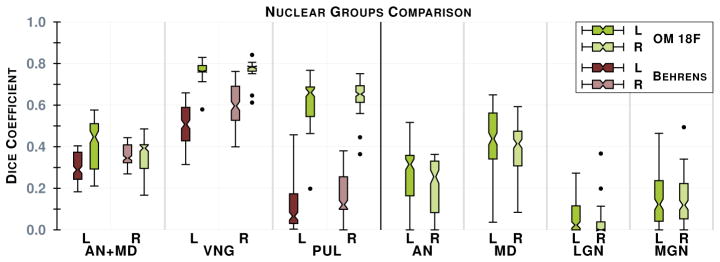
Fig. 3.

The plot on the left is a comparison of the Dice score between our implementation of Behrens et al. [2] (B) (shades of brown) and our method (OM 18F) (shades of green), see the text for details. On the right is the remaining nuclear groups we can generate. Both plots are for our 12 subjects. Results for left and right thalami are denoted L and R, respectively. The notches give a 95% confidence interval for the difference in two medians.
