
Figure 3. Accuracy of OxNASH for predicting the presence of histological features of NASH on liver biopsy.
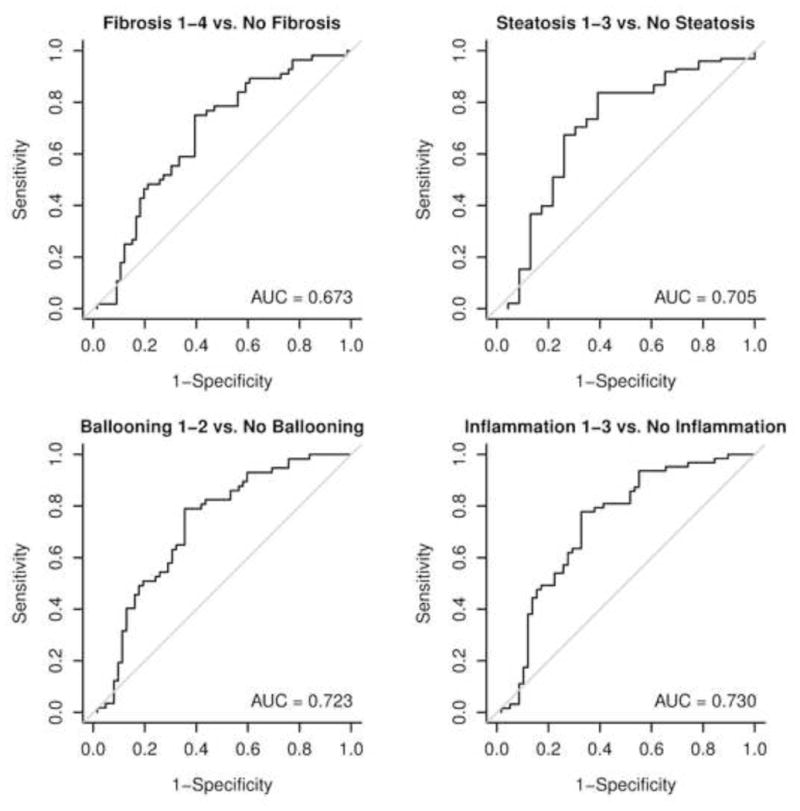
The area under the ROC curve (AUC) was highest for the prediction of inflammation followed by ballooning, steatosis and fibrosis.
Official websites use .gov
A
.gov website belongs to an official
government organization in the United States.
Secure .gov websites use HTTPS
A lock (
) or https:// means you've safely
connected to the .gov website. Share sensitive
information only on official, secure websites.
The area under the ROC curve (AUC) was highest for the prediction of inflammation followed by ballooning, steatosis and fibrosis.