
Fig 4.
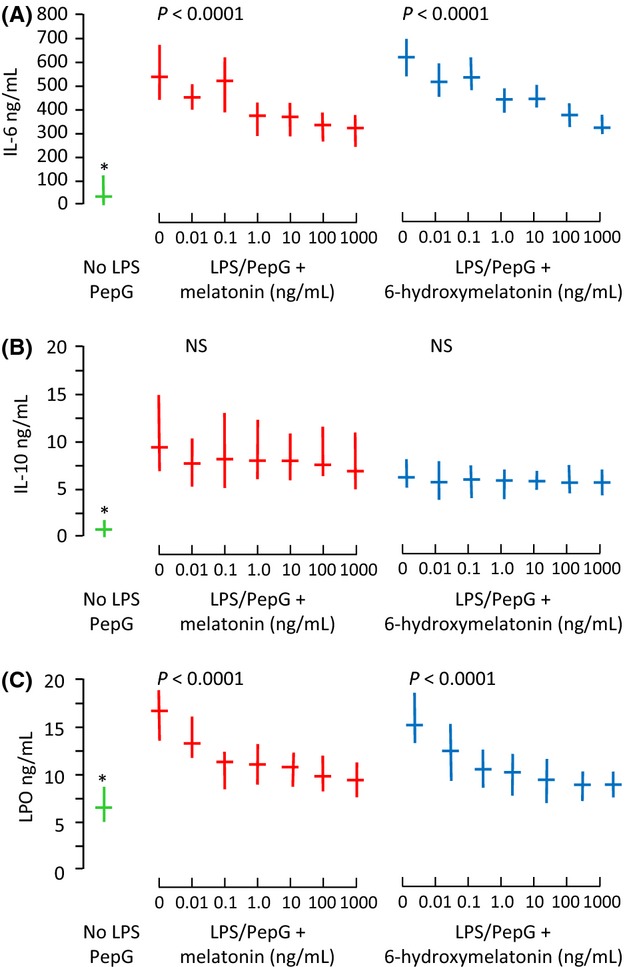
(A) Plasma interleukin-6 (IL-6), (B) IL-10, and (C) lipid hydroperoxide (LPO) from whole blood treated with solvent control (green), lipopolysaccharide and peptidoglycan G (LPS/PepG) plus melatonin (red) or 6-hydroxymelatonin (blue). Median and interquartile range, n = 20 subjects. P-value is Page's trend test. and * = significantly lower than with LPS/PepG alone (Wilcoxon Signed Ranks, P < 0.0001)