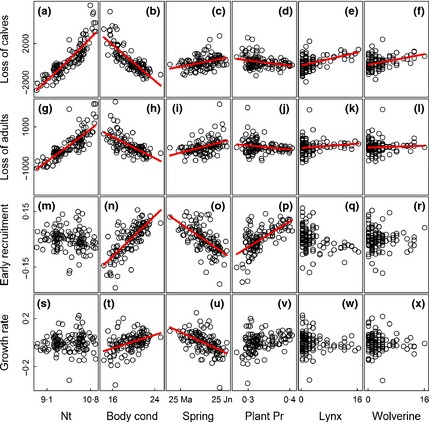
Figure 2.

Regression lines (red lines) and partial residuals for the relationship between log population size (Nt), herd body condition in the previous fall (Body cond), onset of spring (Spring), plant productivity (Plant Pr), population size of lynx and wolverine and (a–f) claimed loss of calves (<1 year); (g–l) claimed loss of adults (>1 year); (m–r) early recruitment and (s–x) population growth rate.
