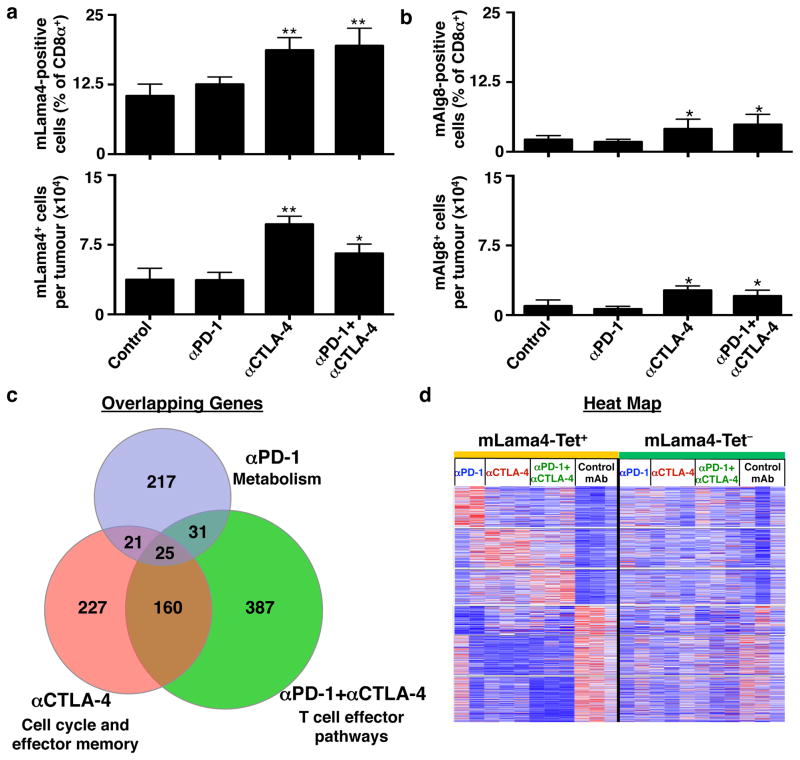
Figure 3. Differential effects of checkpoint blockade therapy on tumour antigen-specific CD8+ T cells.
a, b, Per cent of CD8+ TILs specific for mLama4 (a) or mAlg8 (b) following checkpoint blockade therapy (top). Mean number of mLama4- (a) or mAlg8- (b) specific CD8+ TILs per tumour following checkpoint blockade therapy (bottom). N=5 mice per group pooled. Data are means ± s.e.m. of at least three independent experiments. Samples were compared to control mAb treatment using unpaired, two-tailed Student’s t test (*p<0.05, **p<0.01). c, Venn diagram revealing relationships between differentially expressed genes (p<0.05) in mLama4-specific CD8+ TILs from mice treated with checkpoint blocking mAbs versus control mAb. d, Heatmap showing differentially expressed genes (p<0.05) in mLama4-specific CD8+ TILs from mice treated with checkpoint blocking versus control mAbs. Colour pattern is relative with respect to the row, with red indicating gene upregulation and blue indicating gene downregulation.

