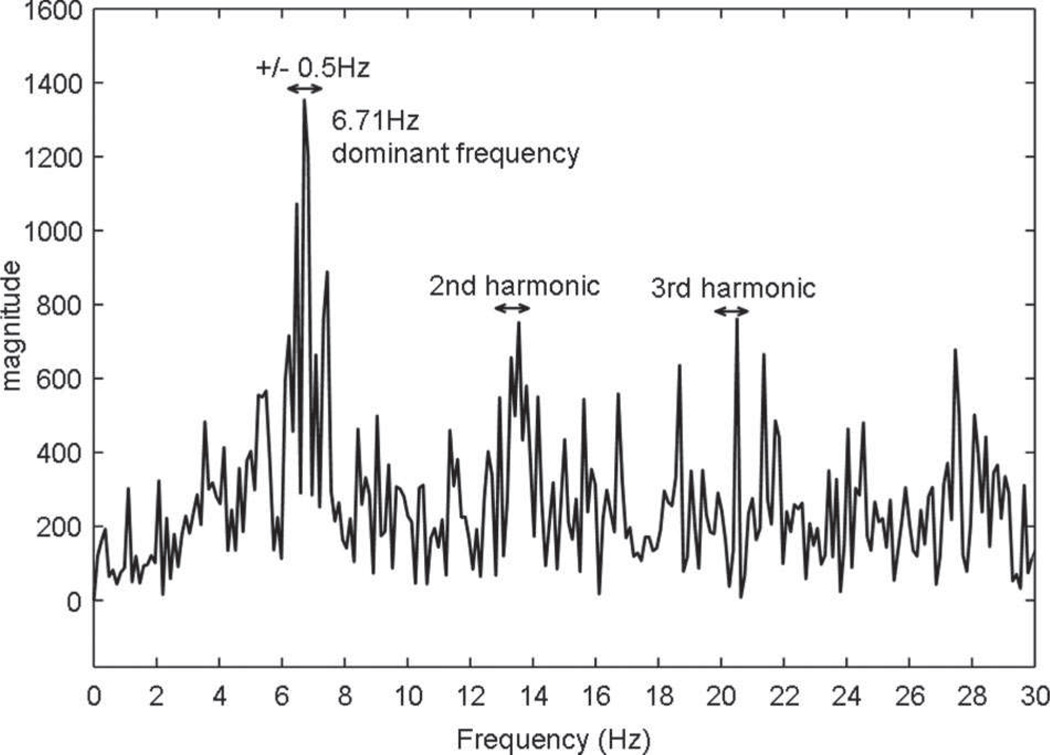
Figure 1.
Fourier power spectrum from 0 to 30 Hz is shown for a CFAE recording obtained from a site outside the LSPV of a patient with persistent AF. The DF is defined as the tallest peak in the power spectrum from 2 to 20 Hz and is located at 6.71 Hz. The RI is defined as the spectral power at the DF ±0.5 Hz (denoted by arrow) divided by the total spectral power in the region of interest (2 to 20 Hz). The OI is defined as the spectral power of the DF and its harmonics ±0.5 Hz combined (denoted by arrows) divided by the total spectral power in the region of interest (2 to 20 Hz).

