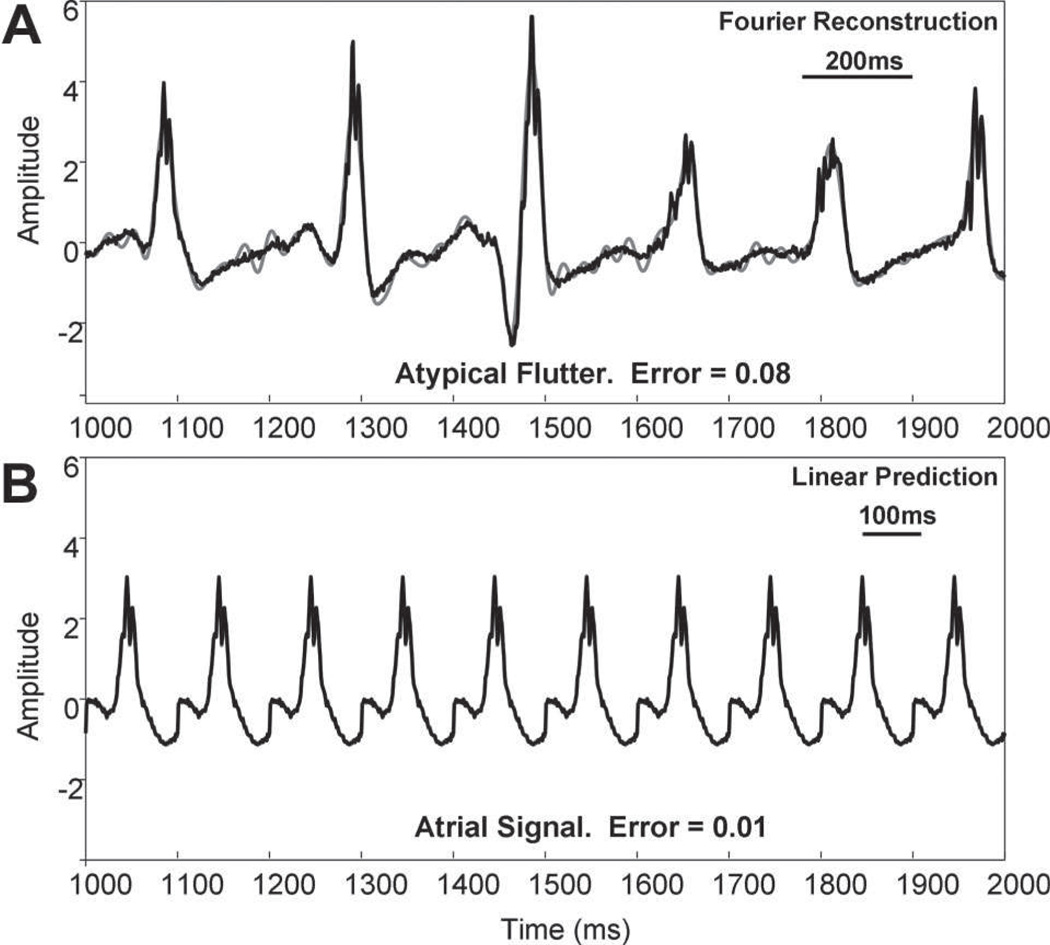
Figure 2.
Fourier reconstruction and linear predictive results (gray traces) for the case of less complex signals (black traces). For ease of comparison, the same scales are used in both panels. A, Fourier reconstruction is shown for an electrogram recorded within the coronary sinus during atypical flutter. The error is only 0.08. B, The first deflection in A (duration, 100 ms) was repeated by simulation to show that linear prediction can model it almost exactly (error=0.01).

