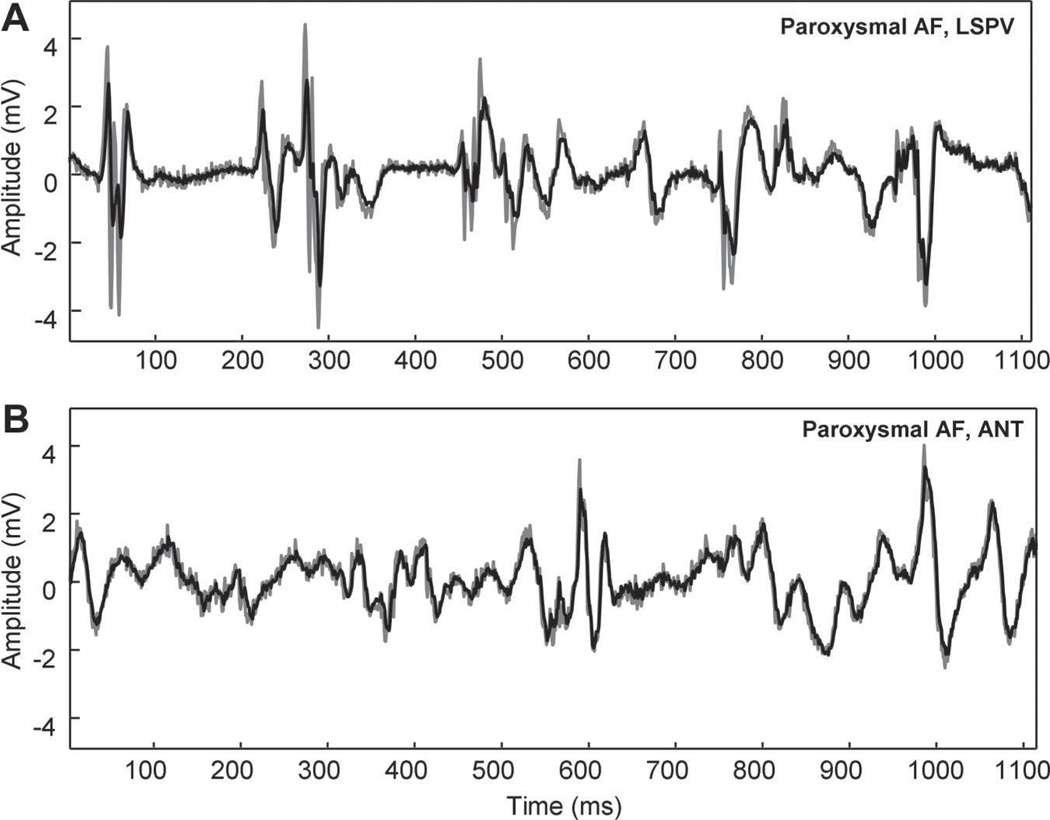
Figure 4.
Comparison of linear prediction outside the LSPV (A) versus ANT LA free wall (B) in a patient with paroxysmal AF for order n=10 (error=0.63 and 0.35, respectively). Shown in each panel, which use the same scale, are the original signal (black) and linear prediction (gray). There is poorer representation of peak deflections at the LSPV location (A).

