Figure 2.

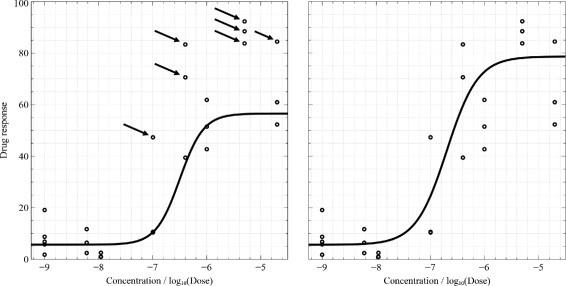
Influence of noise (the arrows show the outliers). Fitting on the left assigns low weights to the outliers to disregard them. Fitting on the right considers the outliers as useful data points and gives higher weights to these points.

Influence of noise (the arrows show the outliers). Fitting on the left assigns low weights to the outliers to disregard them. Fitting on the right considers the outliers as useful data points and gives higher weights to these points.