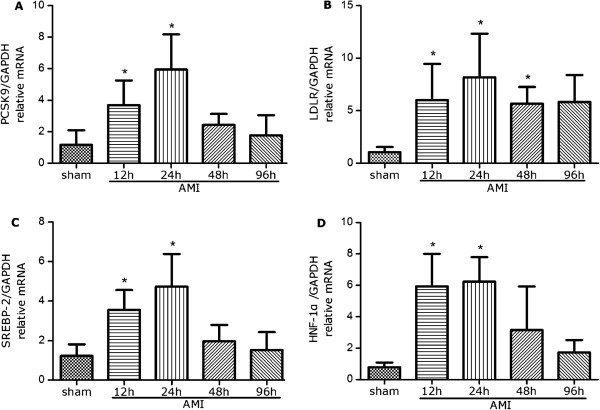
Figure 2.

The mRNA expression of PCSK9 (A), LDLR (B), SREBP-2 (C) and HNF1α (D) in the liver were measured using real-time PCR. The relative ratio and standard deviation were calculated using comparative CT method (ΔΔCT value). All results were normalized against GAPDH. *P < 0.05 vs. control. PCSK9 = proprotein convertase subtilisin/kexin type 9; LDLR = low-density lipoprotein receptor; SREBP-2 = sterol regulator element–binding protein-2; HNF1α = hepatocyte nuclear factor 1α; GAPDH = glyceraldehyde 3-phosphate dehydrogenase.
