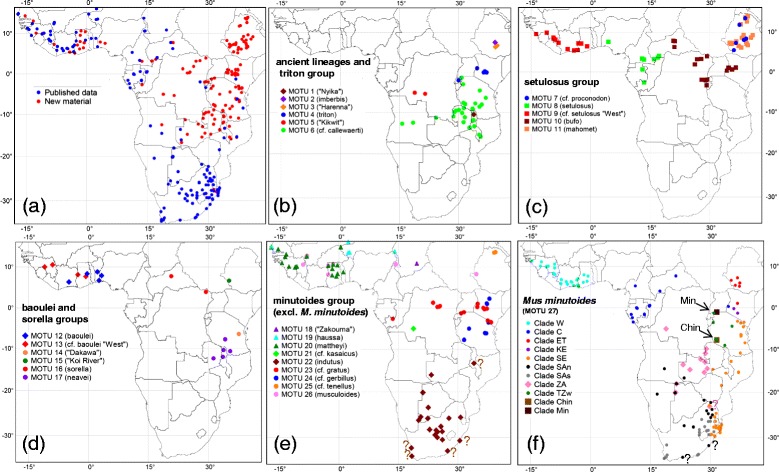
Figure 1.

Distribution of genotyped specimens and individual MOTUs. (a) Distribution of analyzed material of Nannomys in Africa. Blue dots indicate the geographical position of published sequences (downloaded from GenBank), red dots show the localities of newly sequenced individuals. Geographical distribution of (b) MOTUs of the triton group (circles) and three ancient monotypic lineages (rhombuses); (c) MOTUs of the setulosus group; (d) MOTUs of the baoulei (rhombuses) and the sorella (circles) groups; (e) MOTUs of the minutoides group (except M. minutoides); (f) phylogeographic structure of MOTU 27, i.e. M. minutoides. In Figures 1e identical symbol shapes represent monophyletic groups. In Figure 1f the clade abbreviations correspond to Figure 4. Question marks indicate doubtful records based on genotyping of old museum material (see [64]). For more information on analysed material see Additional file 1.
