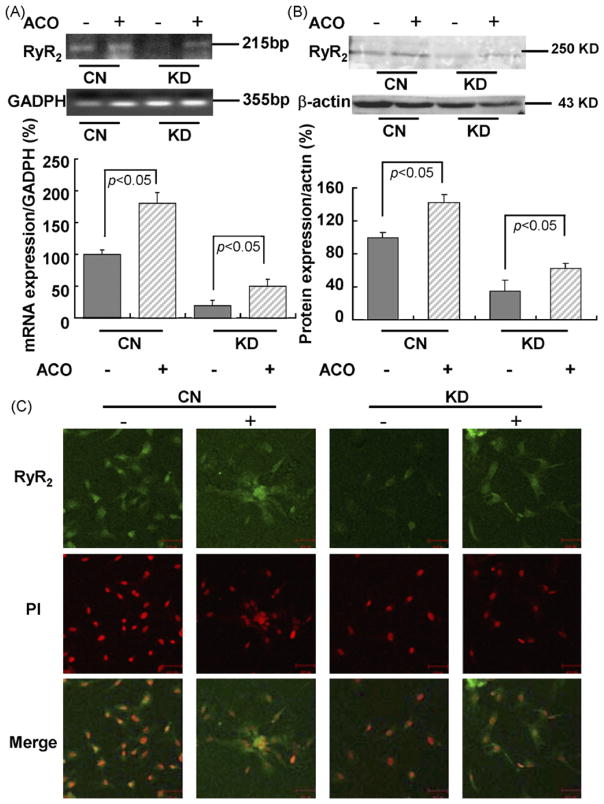
Fig. 2.
Effects of aconitine on mRNA and protein levels of RyR2 in control cardiomyocytes and knockdown cardiomyocytes (with siRNA3 transfection after 48 h) tested by RT-PCR, western blot, and immunostaining. (A and B) Changes in mRNA and protein levels of RyR2 in CN and KD cardiomyocytes before and after aconitine application for 0.5 h. GAPDH and β-actin were used as standards for analyses of the protein and total RNA samples, respectively. Data are presented as the mean ± S.E. Differences were considered statistically significant when p-value <0.05, t-test, n = 4. (C) Immunostaining of RyR2 fluorescence in CN and KD cardiomyocytes before and after aconitine application, respectively, using the anti-RyR primary antibody (scale bar: 50 μm). Immunofluorescence staining on cardiomyocytes RyR positive signals is better observed in the cytosol (green signals). All nuclei were stained with PI (CN, control; KD, knockdown; ACO, aconitine).

