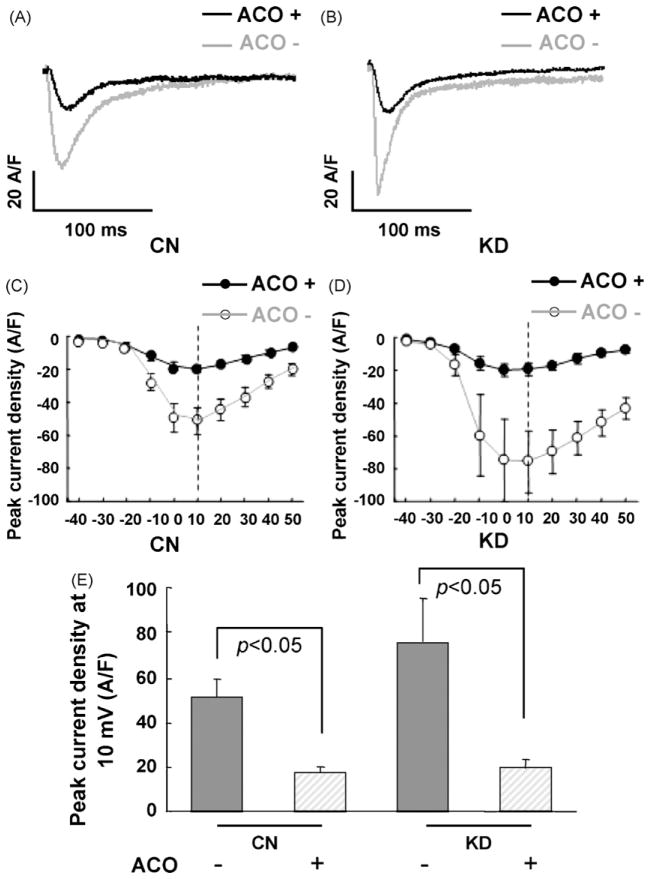
Fig. 5.
Effects of aconitine on the L-type Ca2+ currents in control cardiomyocytes and knockdown cardiomyocytes (with siRNA3 transfection after 48 h) examined by patch clamp. (A and B) L-type Ca2+ currents recorded at 10 mV command potential in CN and KD cardiomyocyes before (gray trace) and after (black trace) aconitine application for 5 min. (C and D) ICa–V relationships in CN (hollow circle) and KD cardiomyocytes (solid circle) before (gray trace) and after (black trace) aconitine application. (E) Peak current density at 10 mV command potential in CN and KD cardiomyocyes. Data are presented as the mean ± S.E. Differences were considered statistically significant when p-value <0.05, t-test, n = 5 cells per plate, five plates (CN, control; KD, knockdown; ACO, aconitine).

