
Figure 1. Induction of AR by ET-1 is on both protein and mRNA levels.
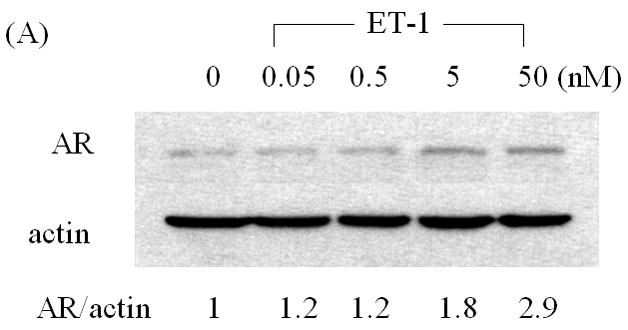
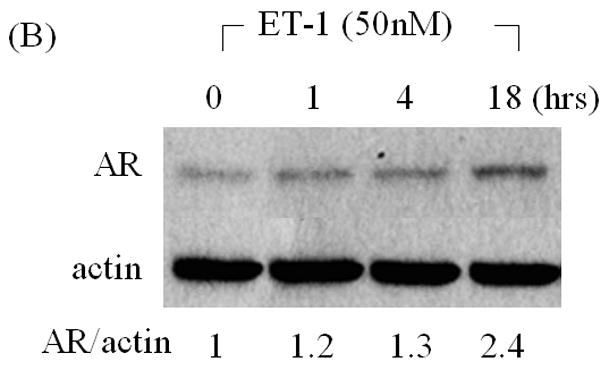
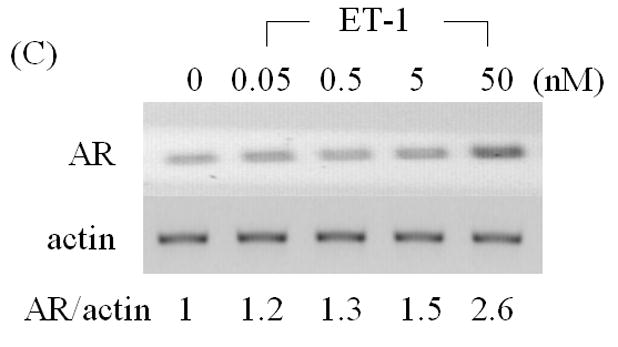
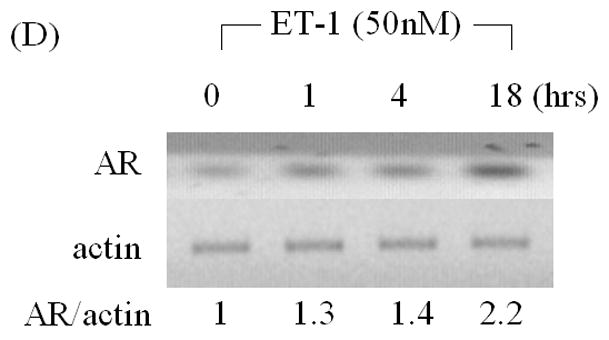
(A) LNCaP cells were cultured in MEM supplemented with 5% charcoal stripped (CS) serum. Twenty-four hours later, treatments of various concentrations of ET-1 (0, 0.05, 0.5, 5.0 and 50 nM) were carried out for 18 hours. Western blots of cell lysates were probed with AR and actin antibodies respectively. (B) Lysates from LNCaP cells cultured in MEM containing 5% CS and treated with 50 nM ET-1 at various time points (0, 1, 4, 18 hrs) were subjected to Western analysis as described in (A). (C) & (D) RNAs extracted from LNCaP cells with the same treatments as shown in (A) & (B) were analyzed by RT-PCR using primer pairs specific to AR and actin and resolved on a 1% agarose gel. All experiments were repeated at least three times with two independent preparations of cell lysates with similar results. Relative density of band was calculated by taking control as 1.