Figure 1.

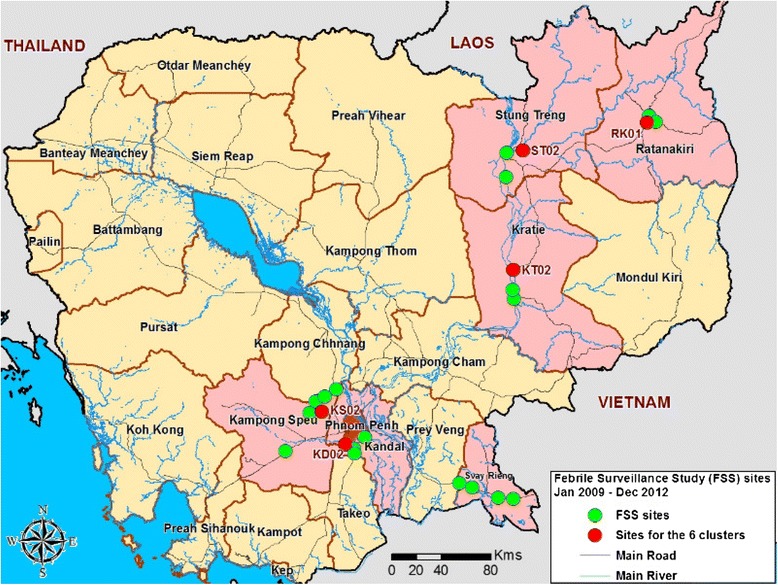
Map of NAMRU-2PP Febrile Surveillance Study health center sites from January 2009 to December 2012. The locations of the 6 clusters are indicated in red. Pink represents the 6 provinces where the study was conducted.

Map of NAMRU-2PP Febrile Surveillance Study health center sites from January 2009 to December 2012. The locations of the 6 clusters are indicated in red. Pink represents the 6 provinces where the study was conducted.