
Figure 4.
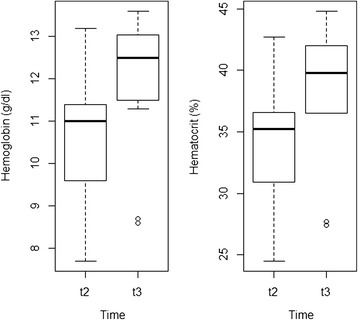
Box plots showing the significant differences (p < 0.05) in the mean haemoglobin concentration and in the PCV of the ibexes just before the start of treatment (t2) and one month later (t3).
Official websites use .gov
A
.gov website belongs to an official
government organization in the United States.
Secure .gov websites use HTTPS
A lock (
) or https:// means you've safely
connected to the .gov website. Share sensitive
information only on official, secure websites.
Box plots showing the significant differences (p < 0.05) in the mean haemoglobin concentration and in the PCV of the ibexes just before the start of treatment (t2) and one month later (t3).