
Figure 5.
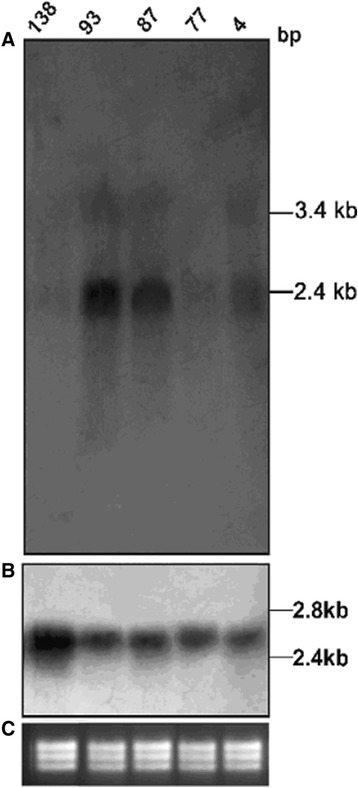
Northern blot analysis for detection of (A) γ glutamylcysteine synthetase ( GCS ) gene overexpression (B) α-tubulin gene probe (C) EtBr stained rRNA bands showing equal loading.
Official websites use .gov
A
.gov website belongs to an official
government organization in the United States.
Secure .gov websites use HTTPS
A lock (
) or https:// means you've safely
connected to the .gov website. Share sensitive
information only on official, secure websites.
Northern blot analysis for detection of (A) γ glutamylcysteine synthetase ( GCS ) gene overexpression (B) α-tubulin gene probe (C) EtBr stained rRNA bands showing equal loading.