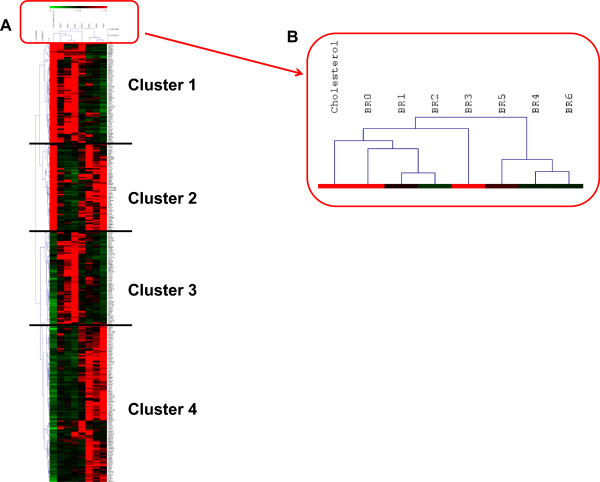
Figure 1.

Hierarchical Clustering of the 308 genes with significant expression changes after membrane cholesterol increase and during AD progression (A). Magnification of the sample tree shows that early and late Braak stages are clearly discriminated while cholesterol treatment segregates with early stages (B).
