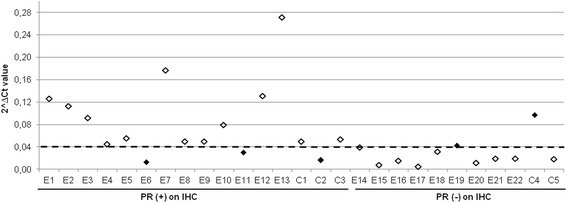
Figure 2.

Comparison of RT-qPCR values versus immunohistochemical assessment in the 27 samples. The Y-axis shows PR mRNA expression values and the X-axis the PR (+) and (−) samples by IHC. The cut-off for PR (+) status by RT-qPCR is indicated by the horizontal broken line. Black diamonds show the discrepancy between the two methods.
