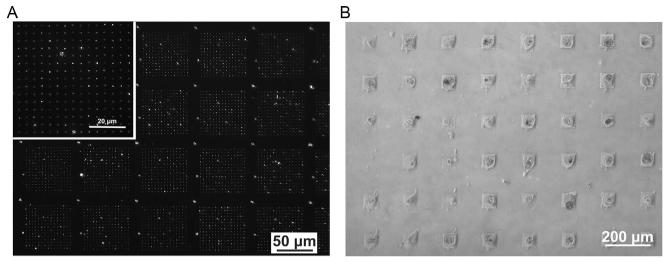
FIGURE 14.2.
(A) The resulting fibronectin patterns can be visualized by immunofluorescence staining with AF 468 conjugated antibody. The pitch of the master array used to generate these features corresponded to 80 μm. (B) Optical micrograph of mesenchymal stem cells (MSCs) seeded on fibronectin adhesion sites displays only one cell per 60 μm × 60 μm patterned square region. A master array having a pitch of 180 μm was used to generate these features.

