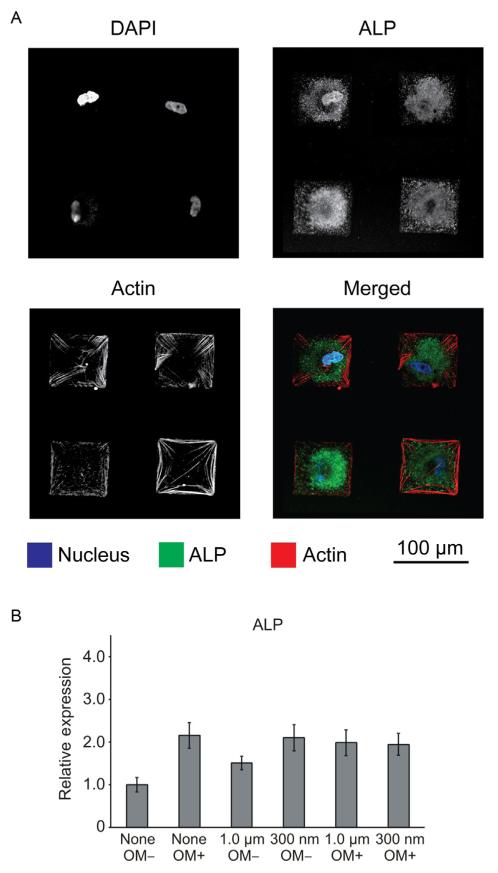
FIGURE 14.4.
Immunofluorescence micrographs show the expression of osteogenic marker alkaline phosphatase (ALP) in MSCs cultured on homogeneous (300 nm diameter) fibronectin patterns. (A) The confocal microscopy images in the merged channel display samples stained for actin in red, ALP in green, and the nucleus in blue. (B) Quantitative RT-PCR results for ALP were normalized to GAPDH levels. The bar graph also displays results that were normalized to the negative control: no pattern in absence of osteogenic media (OM –).

