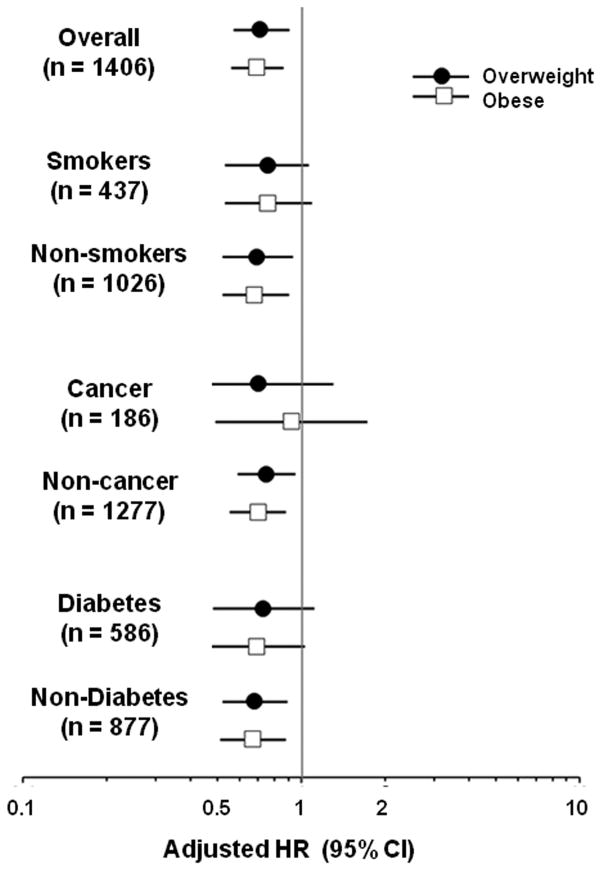
FIGURE 1. Adjusted Risk of Mortality Associated with BMI Category.
The adjusted hazard ratios (HR) and 95% confidence intervals (CI) for mortality risk for the obese and overweight groups compared to the normal-weight group (reference group; HR = 1) are shown on a logarithmic scale for the overall cohort, and for the subgroups stratified by smoking, cancer, and diabetes. The results are consistent across all subgroups.

