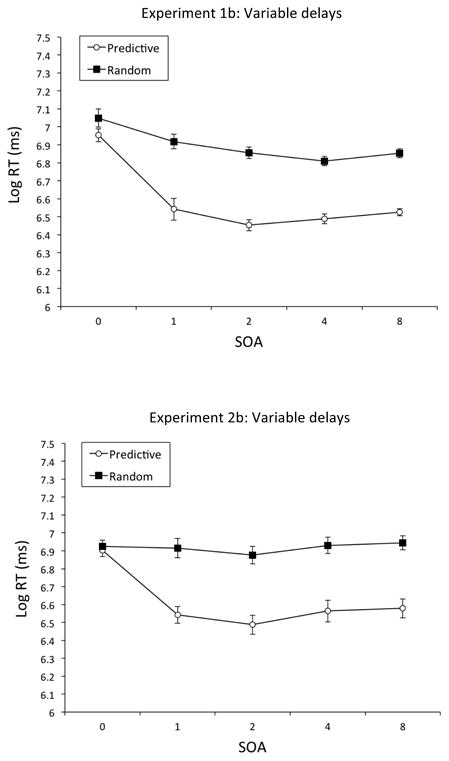
Figure 5.

Mean RTs for the 5 SOA conditions in Experiments 1b and 2b: Variable delays. Top Panel: Mean Log RTs (ms) for the Predictive and Random conditions for each SOA in Experiment 1b: Variable delays. Bottom Panel: Mean Log RTs (ms) for the Predictive and Random conditions for each SOA in Experiment 2b: Variable delays. Error bars represent the standard error of the mean. As a guide to calibrating Log RTs to RTs (ms): Log RT of 6 = 403 ms, Log RT of 6.5 = 665 ms, Log RT of 7 = 1,097 ms, and Log RT of 7.5 = 1,808 ms.
