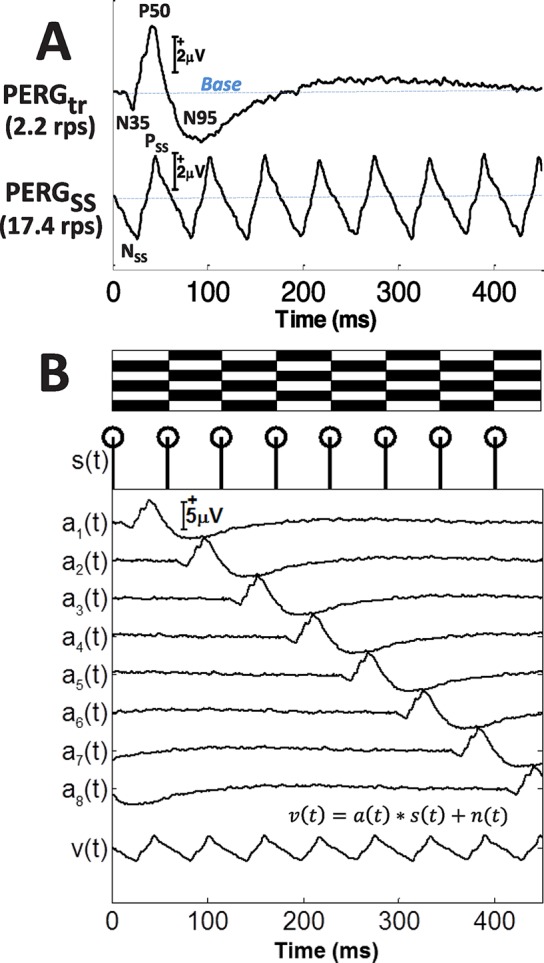
Figure 1.

(A) Waveforms of PERGtr (first row) and PERGSS (second row) from one subject (S01) recorded at 2.2 and 17.4 rps, respectively. The tr peak names (N35, P50, and N95) and SS peaks (NSS and PSS) are labeled as shown. (B) Diagram depicting the superposition generation of PERGSS, v(t) at 17.4 rps using temporally shifted PERGtr waveforms, a(t). The isochronic stimulus sequence s(t) is depicted by the trigger signals below the alternating bars. To generate the synthetic PERGSS, tr waveform a(t) is shifted in a cyclic mode eight times according to the trigger signal s(t), and the resulting waveforms are averaged to produce v(t), the synthetic waveform synPERGSS. System noise is represented by n(t).
