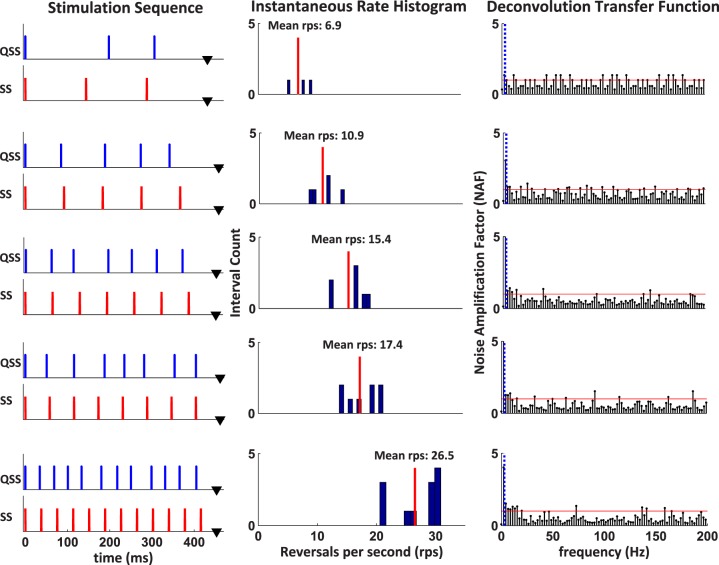
Figure 2.
Ten stimulation sequences (trigger signals), a QSS and SS sequence at each mean reversal rate, are shown in the left column. The SS sequences are used to obtain PERGSS while QSS sequences are used to obtain the qPERGSS. Instantaneous rate histograms of the QSS sequences are shown in the middle column. Mean reversal rates for each sequence are shown as a vertical line in each histogram. The NAFs for each sequence are plotted as a function of frequency in the right column. The DC component and first frequency bin of each sequence is eliminated, as shown with the vertical dotted line. The horizontal line in each deconvolution transfer function shows NAF equal to 1, and shows the noise amplification/attenuation boundary.

