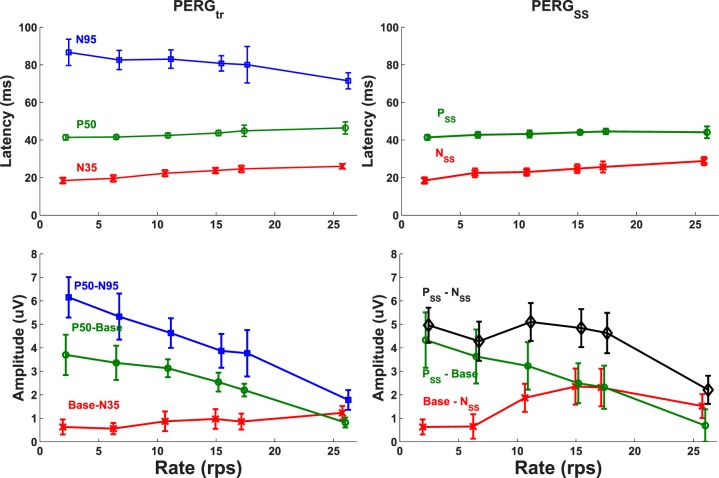
Figure 8.
Latency and amplitude characteristics of the tr (right column) and SS (left column) PERG response peaks as a function of reversal rate. Population averages and standard deviations are indicated by middle points and vertical bars at each data point marker. Latencies of tr (N35, P50, and N95) and SS (NSS and PSS) peaks and their amplitude measurement conventions are plotted on the top and bottom panels, respectively.

