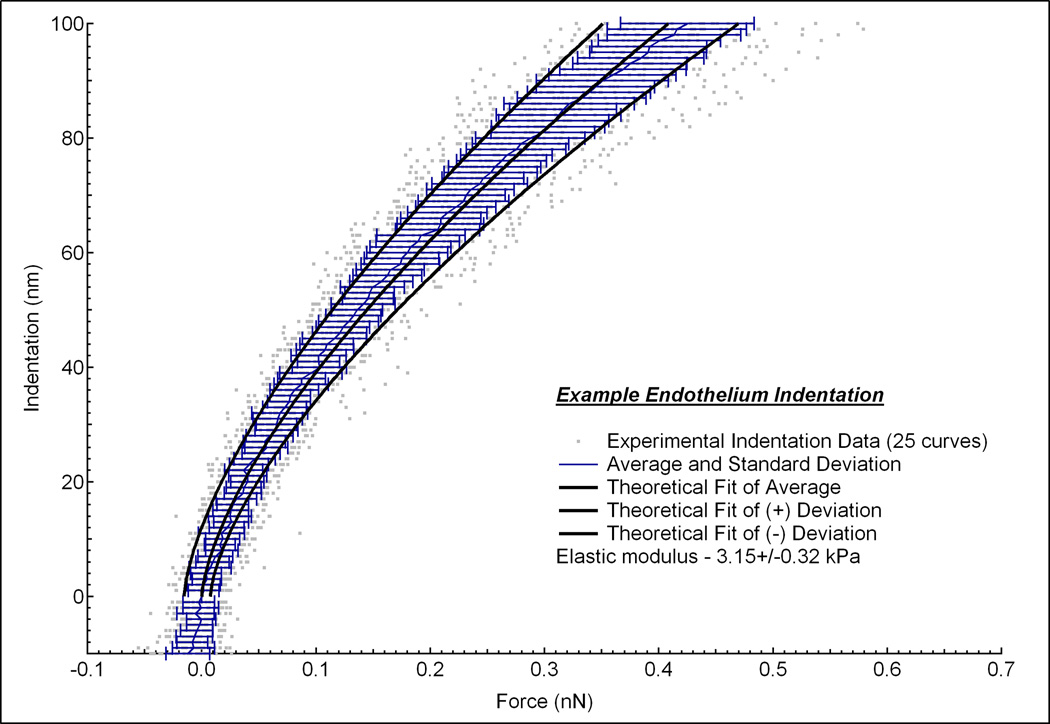
Fig 2.
Indentation vs. force curves measured at 5 positions on the endothelium from one rabbit. At each position, 5 force curves were measured (gray dots). The average and standard deviation of these 25 curves were calculated at each indentation depth (blue lines). From this data, a single curve of the fitted average and two additional curves of the positive and negative standard deviations were generated (black lines).Linear least-square fits of the data using the Hertz model was then performed to the elastic region of the average, positive and negative standard deviations to give an elastic modulus of 3.15 ± 0.32 kPa.

