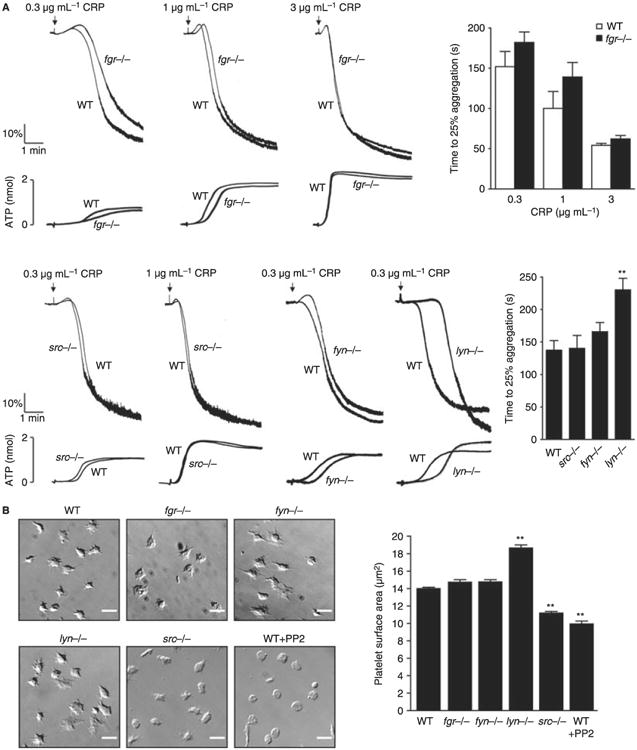
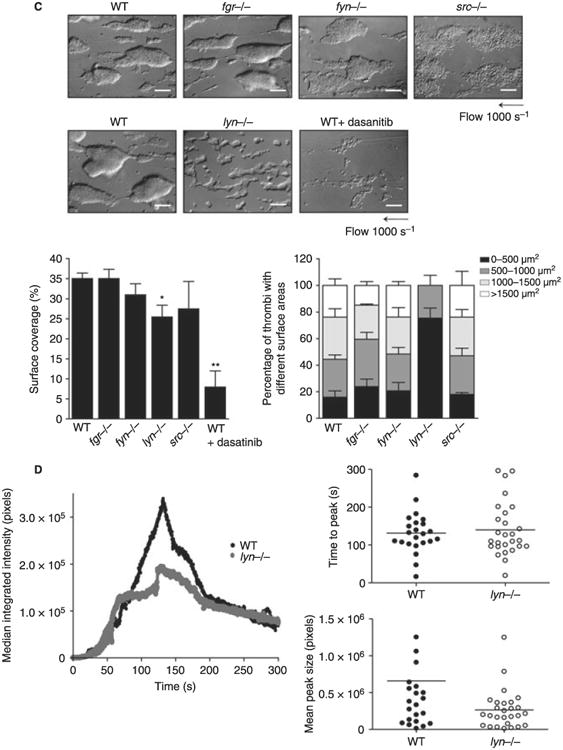
Fig. 2.


Impact of deficiency of Src family kinases (SFK) in platelet responses. (A) Washed platelets (2 × 10⁸ mL−1) prepared from fyn−/−, lyn−/−, src−/− or fgr−/− mice and their respective litter-matched controls were stimulated with different doses of collagen-related peptide (CRP) (0.3, 1 and 3 μg mL−1). Platelet aggregation was measured as a change in light transmission and ATP secretion was measured as luciferin/luciferase-mediated luminescence, using a lumi-aggregometer. Representative images are shown (n = 3–6 mice per condition). The time to 25% of aggregation was calculated and data are shown as mean ± standard error of the mean (SEM). One-way anova test, **P < 0.01 vs. wild type (WT). (B) Washed platelets (2 × 10⁷ mL−1) from fgr−/− fyn−/−, lyn−/− or src−/− and their respective litter-matched controls or WT platelets treated for 10 min with 10 μmol L−1 PP2 were placed on a fibrinogen-coated surface for 45 min. Platelets were fixed and images captured using differential interference contrast (DIC) microscopy (scale bar: 5 μm). Representative DIC images of platelets captured from four independent experiments for each genotype are shown. The surface area of platelets per condition were measured using ImageJ software (mean ± standard error of the mean [SEM]; n = 150–300 individual platelets per mice; four mice per genotype). Oneway anova test, *P < 0.05 vs. WT. (C) Anticoagulated blood from lyn−/−, fyn−/−, src−/− or fgr−/− and their respective litter-matched controls or WT platelets treated for 10 min with 3 μmol L−1 Dasatinib was perfused through collagen-coated capillary tubes at 1000 s−1 for 4 min. DIC images of fixed platelets on collagen fibers after being flowed through collagen-coated capillary tubes at 1000 s−1 for 4 min (scale bar: 20 μm) are shown. Representative images of thrombus formed from at least three independent experiments of each genotype are shown. Area covered by platelet thrombi and the percentage of thrombi with different surface were measured in each of at least three different experiments and mean ± SEM is shown. One-way anova test, *P < 0.05, **P < 0.01 vs. WT. (D) Platelets from WT or Lyn-deficient mice were fluorescently labeled ex vivo with rat anti–mouse αIIb primary antibody and Alex488-conjugated secondary antibody before being reintroduced into recipient mice. Arterioles in cremaster muscles of recipients were subsequently injured by laser, and the accumulation of platelets into the thrombi was assessed. Curves represent the median integrated thrombus fluorescence intensity in arbitrary units (pixels) for 23–25 thrombi induced in five mice of each genotype. Dot plot represents time to peak (seconds) and mean peak size (pixels) from between 23 and 27 thrombi from five mice.
