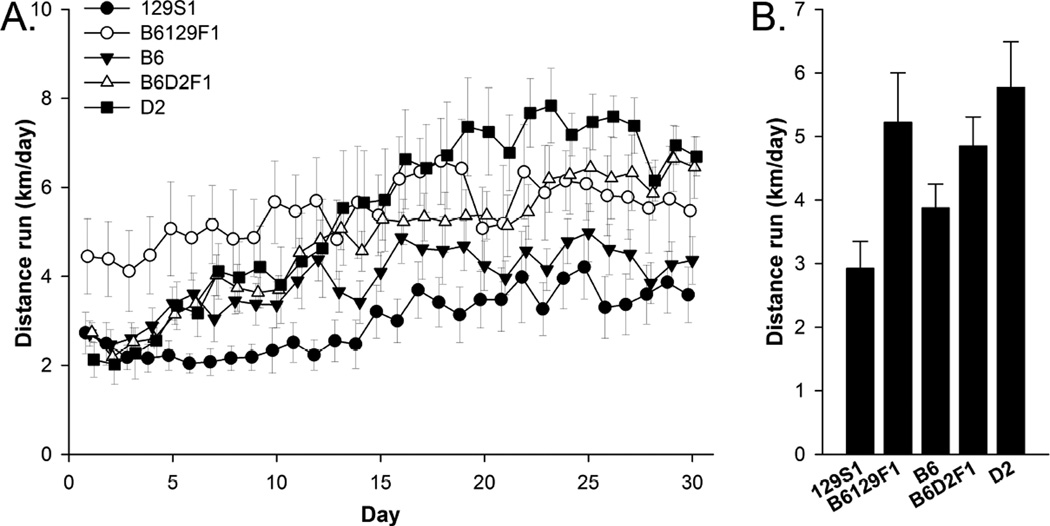
Figure 1.
Wheel running. A) Average daily distance traveled (km/day) during the first 30 days of uninterrupted wheel access shown separately for the 5 strains. B) Average distance traveled (km/day) collapsed across the 30 days of wheel access. Level of running escalated by day and varied by strain. Standard error bars shown, n=10 or 11 animals per group.

