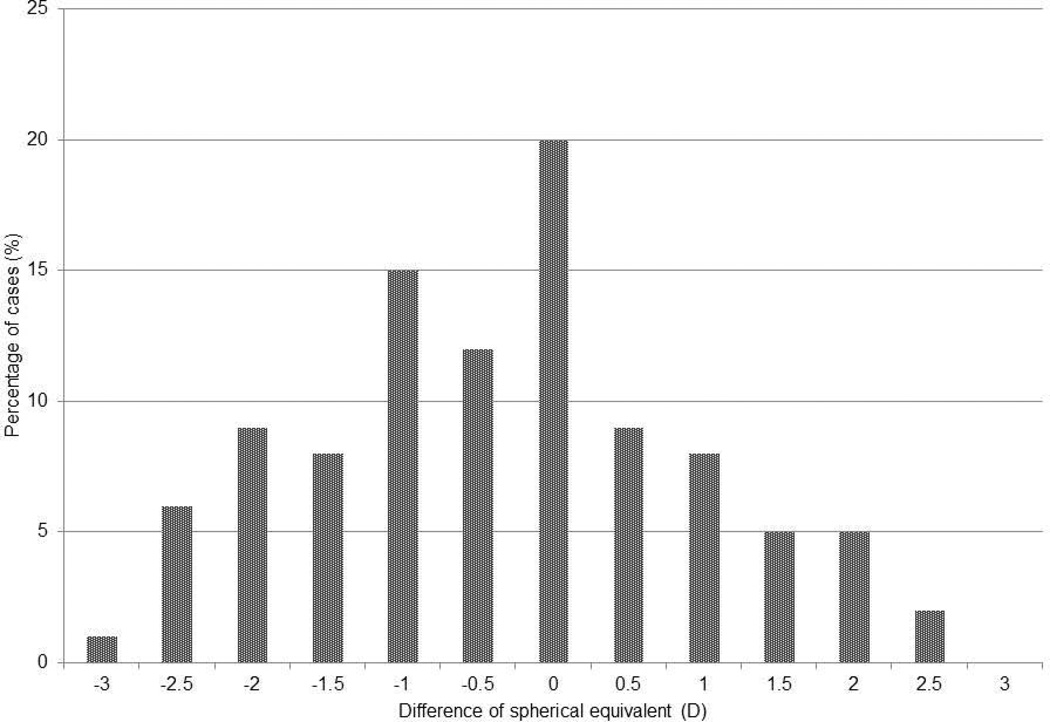
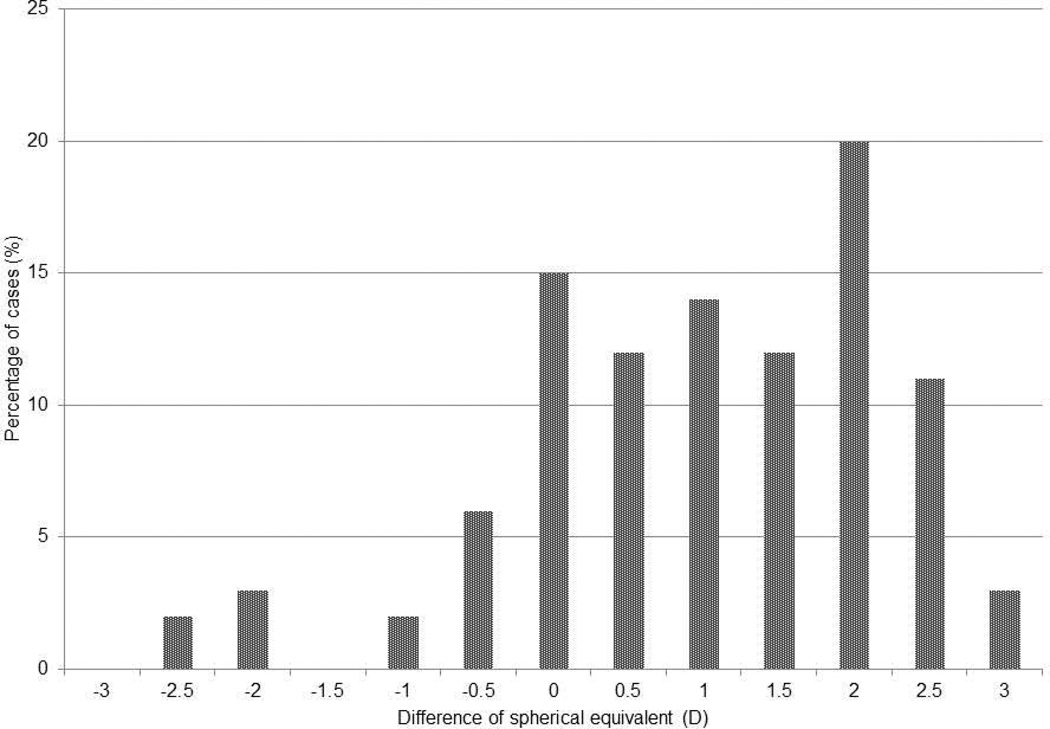
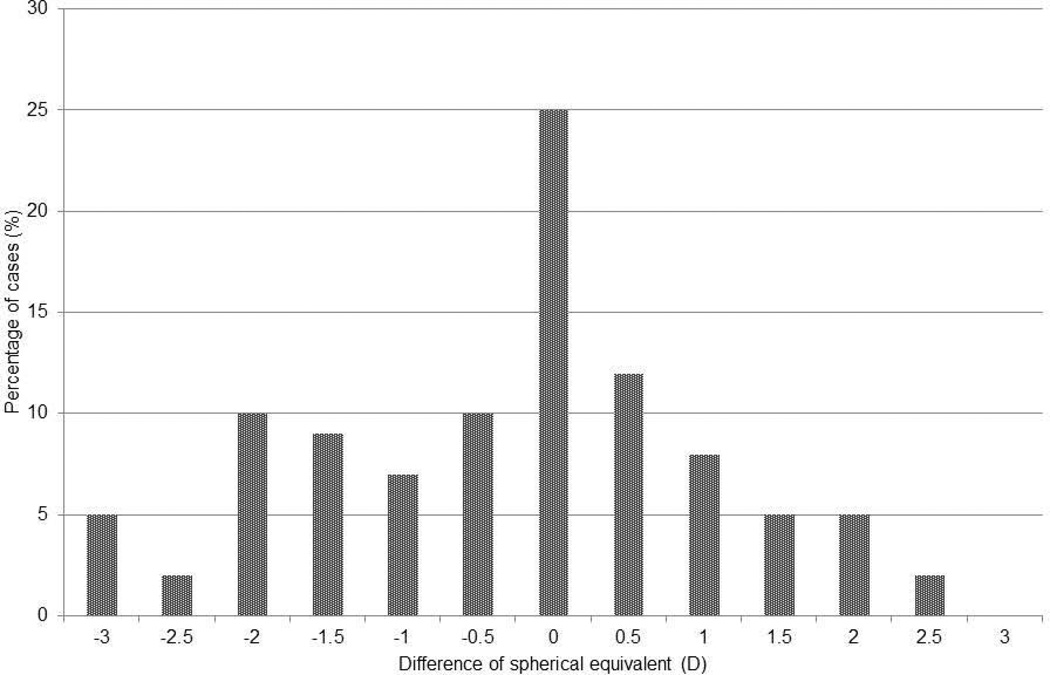
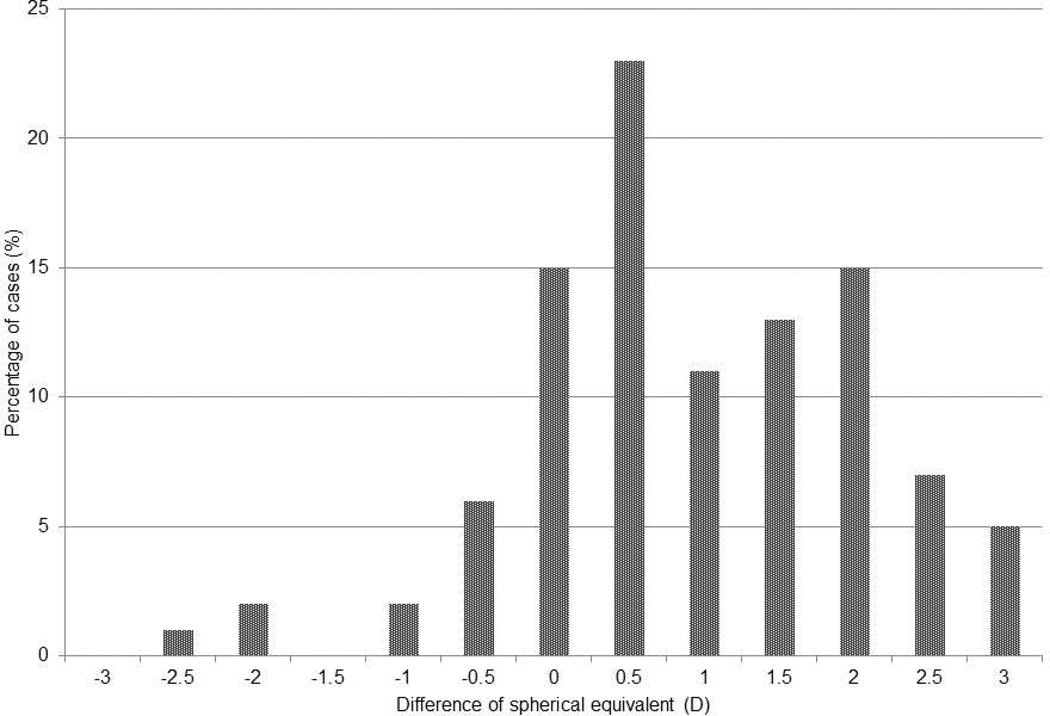
Figure 1.
Frequency distribution of the difference of spherical equivalents between autorefraction and retinoscopy: a, non-cyclopleged autorefractor versus cyclopleged retinoscopy; b, cyclopleged autorefractor versus non-cyclopleged retinoscopy; c, non-cyclopleged autorefractor versus non-cyclopleged retinoscopy; d, cyclopleged autorefractor versus cyclopleged retinoscopy. Each bar represents the percentage of results differing less than the amount displayed on the x-axis


