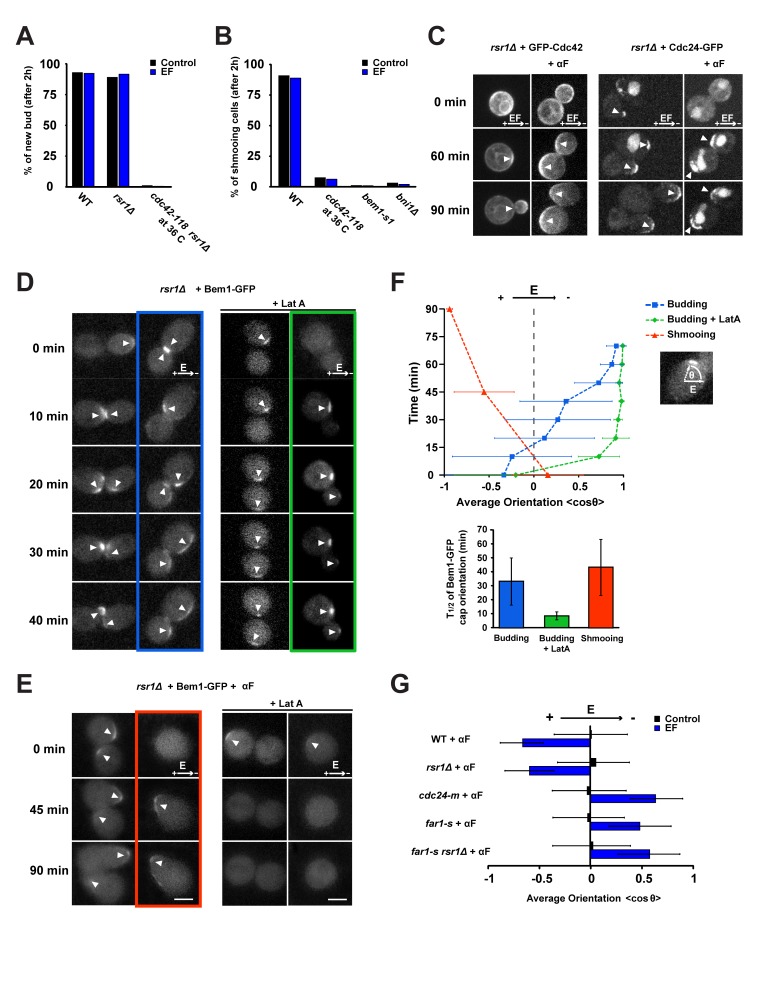
Figure 2. EF response involves Cdc42p polarization.
(A) Percentage of new bud formation after 2 h in the absence or in the presence of an EF for a population of WT, rsr1Δ, and cdc42-118 rsr1Δ (at restrictive temperature, 36°C). (B) Percentage of shmoo formation after 2 h in the absence or in the presence of an EF for a population of WT, cdc42-118 (at restrictive temperature), bem1-s1, and bni1Δ cells treated with α-factor (αF). (C) Confocal single plane time-lapse images of GFP-Cdc42 and Cdc24-GFP expressed in rsr1Δ cells grown under an EF, in the absence or in the presence of α-factor. White arrowheads indicate the successive positions of the protein polar caps. (D) Confocal single plane time-lapse images of Bem1-GFP in control and LatA-treated rsr1Δ cells grown in the absence and in the presence of an EF. White arrowheads indicate the successive positions of Bem1-GFP polar caps. (E) Confocal single plane time-lapse images of Bem1-GFP in control and LatA-treated rsr1Δ cells grown with or without an EF in the presence of α-factor. Note that LatA treatment induces rapid dispersion of the Bem1-GFP signal at the cap, with or without EF. White arrowheads indicate the successive positions of Bem1-GFP polar caps. (F) Temporal evolution of the average orientation of Bem1-GFP caps with respect to the applied EF in a population of rsr1Δ cells, treated with and without LatA or α-factor (top) (n = 13 cells for budding [blue], n = 9 cells for budding + LatA [green], n = 4 cells for shmooing [red]). Half-time (t 1/2) corresponding to the mean orientation of Bem1-GFP polar caps to the cathode or anode of the EF is shown at the bottom. (G) Average shmoo orientation after 3 h in the absence or in the presence of an EF for a population of WT, rsr1Δ, cdc24-m, far1-s, and rsr1Δ far1-s cells treated with α-factor. n>50 cells for each condition. Error bars represent standard deviations. Scale bars: 2 µm.

