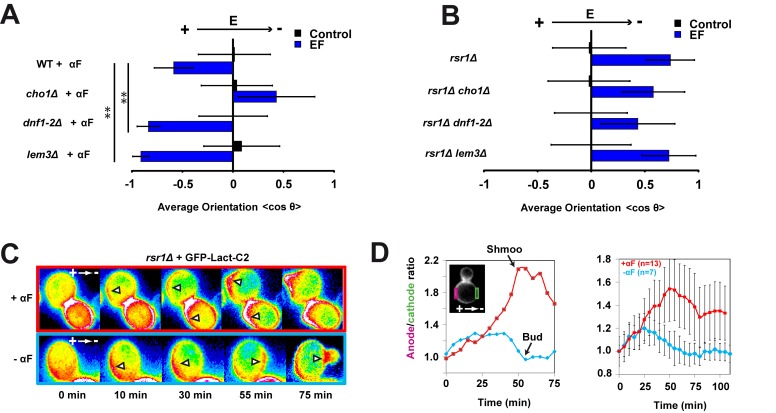
Figure 5. Membrane hyperpolarization orients polarity through local phosphatidylserine accumulation.
(A) Average shmoo orientation in the absence or presence of an EF for a population of WT, cho1Δ, dnf1-2Δ, and lem3Δ cells treated with α-factor (αF) (n>50 cells). (B) Average bud orientation after 3 h in the absence and in the presence of an EF for a population of rsr1Δ, rsr1Δ cho1Δ, rsr1Δ dnf1-2Δ, and rsr1Δ lem3Δ cells (n>50 cells). (C) Sixteen-color epifluorescence time lapses of shmooing and budding cells polarizing in EFs and expressing GFP-Lact-C2 probe (a marker for PS). White arrowheads point at sites of PS accumulation. (D) Quantification of PS localization in EFs. The ratio of anodal versus cathodal signal is computed by measuring the total amount at the membrane on both facing sides of the cell. Left: ratio evolution for the depicted sequences in (C). The black arrows indicate the moment when shmoo tip or bud was first visible. Right: average ratio of anodal versus cathodal PS signal for shmooing and budding cells. **Student's t test, p<0.001. Error bars represent standard deviations.

