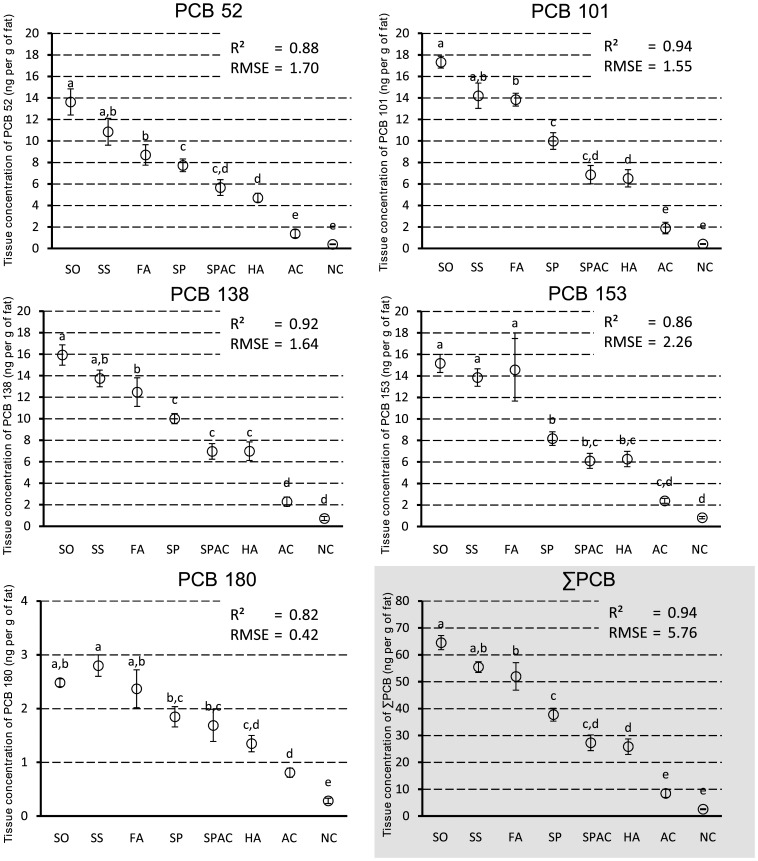
Figure 2. Concentrations (ng.g−1 of fat) of NDL-PCBs in adipose tissue.
Each value represents the adjusted mean ± standard error. Values are presented following treatment groups: Spiked corn oil (SO, n = 5); Standard soil without organic matter (SS, n = 4); 1% OC Fulvic acid soil (FA, n = 4); 1% OC Sphagnum peat soil (SP, n = 5); 1% OC Sphagnum peat soil; Activated Carbon (95∶5) (SPAC, n = 5); 1% OC Humic acid soil (HA, n = 5); 1% Activated carbon (AC, n = 5); Negative controls (NC, n = 5). Letters (a, b, c, d, e, f) indicate values that do not statistically differ from other values within groups presenting a common letter (P<0.05).

