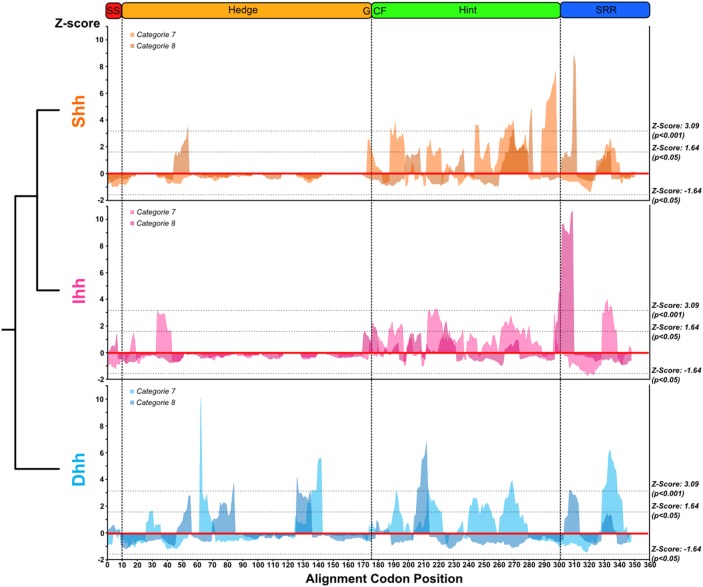
Figure 7. Differences on the amino acid isoelectric point property selection pattern for the three vertebrate Hh paralogs.
Sliding window analysis for the Z-scores calculated for categories 7 and 8 using TreeSAAP [56] for the three vertebrate Hh paralogs, showing the phylogenetic relationship between each group.

