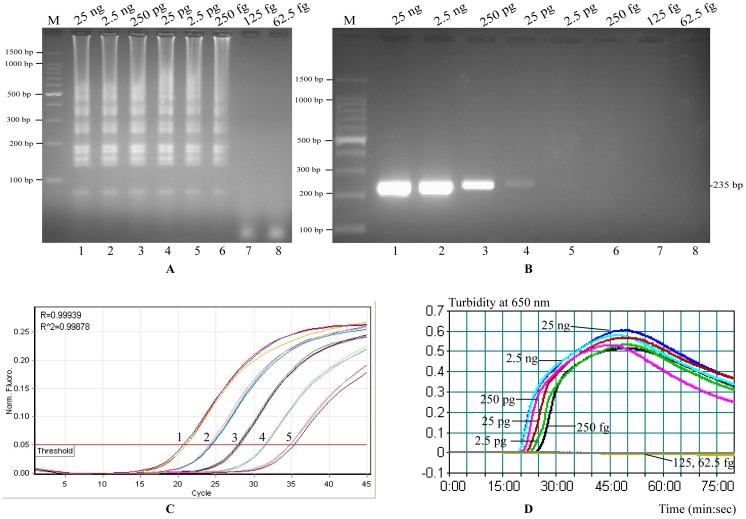
Figure 3. Comparison of the detection limits of the LAMP, PCR and qPCR assays.
(A) and (B) Lane M, DNA marker DL100; Lanes 1–8, the results of LAMP and PCR for 25 ng, 2.5 ng, 250 pg, 25 pg, 2.5 pg, 250 fg, 125 fg and 62.5 fg per reaction, respectively. (A) Detection limit of the LAMP reaction (250 fg/reaction); (B) Detection limit of the PCR (25 pg/reaction); (C) Detection limit of the qPCR (2.5 pg/reaction), signals 1–5, the results of qPCR for 25 ng, 2.5 ng, 250 pg, 25 pg, 2.5 pg DNA per reaction, respectively; (D) Real-time sensitivity of smcL-LAMP as monitored by the measurement of turbidity (optimal density at 650 nm), the threshold value was 0.1 and a turbidity of>0.1was considered to be positive for smcL-LAMP, the detection limit was 250 fg/tube.

