
Figure 1. Schematic diagram of a Stratified Worm Burden (SWB) system.
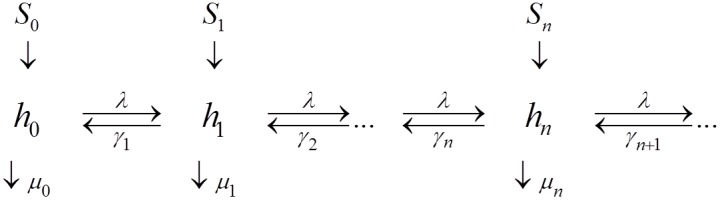
The SWB model includes population strata  , sources
  , population turnover/loss rates
  , the force of infection
  ( = worm accretion rate), and worm clearing rates
  (
( is worm mortality).