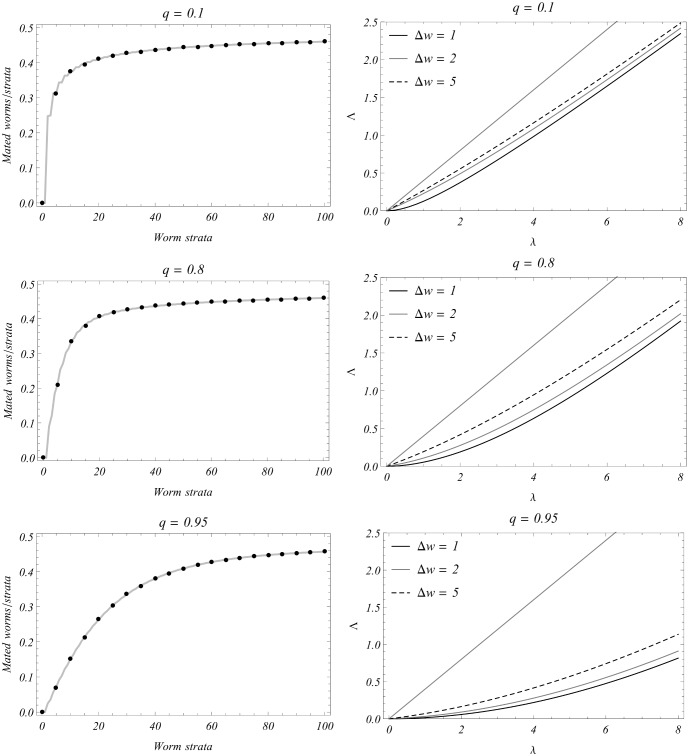
Figure 5. Effect of SWB inputs (the  increment, and the mating hurdle q) on predicted outputs.
Left-hand panels show the distribution of mated pairs in host strata, and right-hand panels show the force of snail infection  . The three plots in each column correspond to different choices of q. Column (a) compares mated fraction
  of equation (20) for fine-grain system
  (gray line) vs. coarse-grained
  (black dots). Step
  has only a minor effect on fraction
  (i.e., low sensitivity), but the force of infection
  (column (b)) shows more sensitivity to
  (higher
  predicts stronger force, particularly at low
  ). Overall, the mating effect on
  is significant - all curves in (b) depart from the simple linear relation
  (the thin, straight line), and increased hurdle factor q also has a significant effect in lowering Λ.

