
Figure 6. Stability regions of the coupled SWB system (13)–(16) for the young-age group.
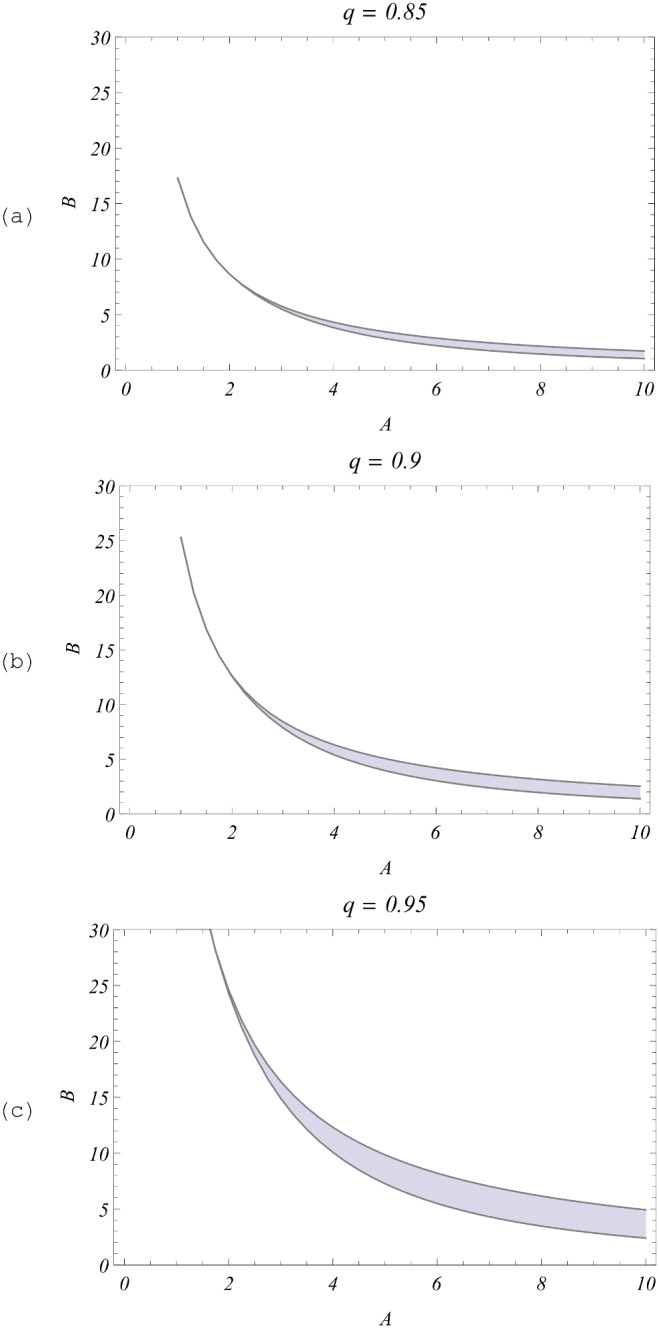
Shown are values for ( ) in A, B - parameter space at different values of mating hurdle q. The shaded region in each plot marks the bistable (zero-breakpoint-endemic) range; all values above it are saddle-nodes (“unstable zero + stable endemic”); below it is the region of “stable zero” (eradication).