
Figure 8. Equilibrium functions for the two types of model.
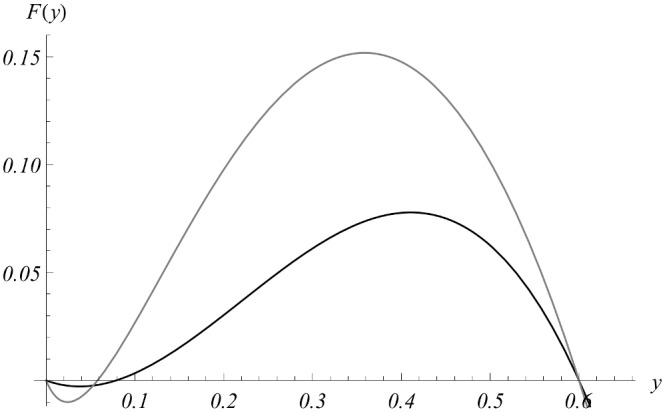
Shown are  : MacDonald equation (19) (gray), and SWB equation (21) (black), for calibrated model parameters of Table 4
Official websites use .gov
A
.gov website belongs to an official
government organization in the United States.
Secure .gov websites use HTTPS
A lock (
) or https:// means you've safely
connected to the .gov website. Share sensitive
information only on official, secure websites.
Shown are : MacDonald equation (19) (gray), and SWB equation (21) (black), for calibrated model parameters of Table 4