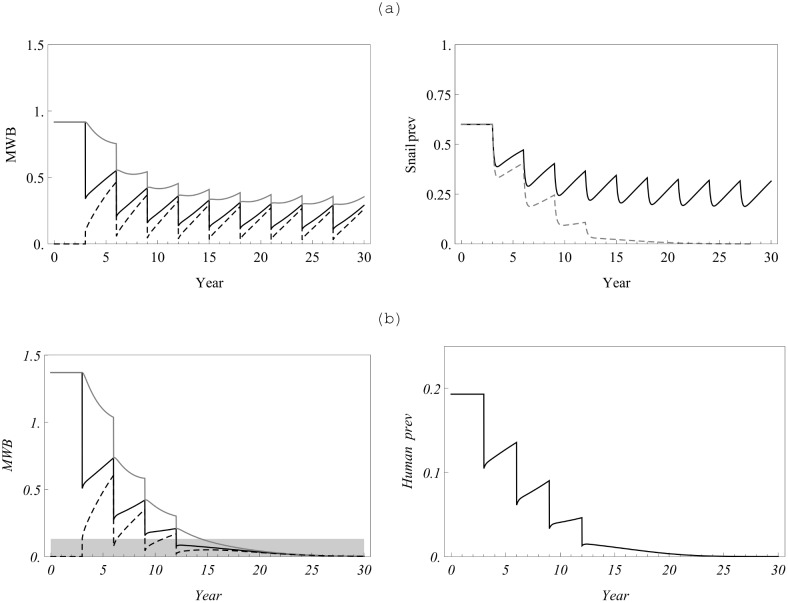
Figure 9. A multi-year treatment cycle with 70% population coverage and drug efficacy of 90%.
Panels indicate results for (a) a simple Macdonald MWB model without mating; (b) a MWB model with NB distribution and an included mating function (equation (36), S3 Appendix in S1 Text) having breakpoint level  (shaded range, lower left hand panel). On both left hand plots, solid black is the overall community MWB,
  ; gray is the untreated group
  , and the dashed line is the treated group
  . The upper right hand panel indicates yearly snail prevalence of infection without (solid line) or with (dashed line) inclusion of the mating factor, and hence the breakpoint, in the model. The lower right hand panel indicates expected human prevalence with MDA treatment in the breakpoint setting.

