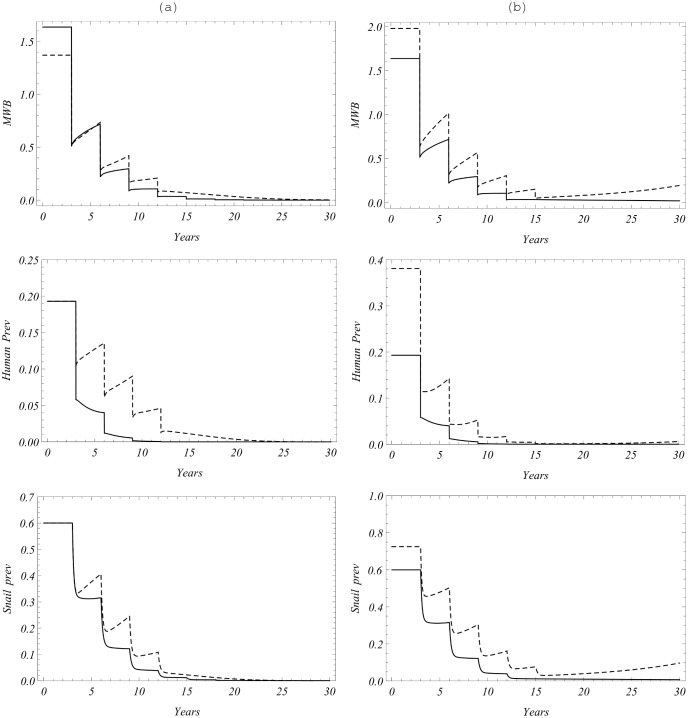
Figure 10. Control of the calibrated SWB system with the same MDA strategy as for previous figure.
The left column (a) compares SWB outputs (mean worm load, human and snail prevalence) in the solid curves, compared with the MWB model outputs shown in the dashed curves. SWB predicts faster (more efficient) reduction of all infection outcomes. Panel (b) compares the SWB system of column (a) (solid) with an MDA-perturbed system where mating hurdle was changed to  (dashed). The perturbed system has no breakpoint (which has sensitive dependence on q in the SWB system) and after an initial four-treatment reduction, infection gradually relaxes to the pre-MDA endemic state

