
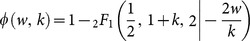
Table 2. Mating function for specific distribution patterns;  is the hypergeometric function,
  - modified Bessel functions of order m.
| Distribution | Mating function | Prevalence of matedcouples (host infectivity) 
|
| Uniform with mean w |
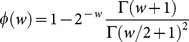
|
|
| Poisson with mean w |

|

|
| NB of mean w, aggregation k |
|
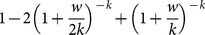
|
(abbreviation: NB, negative binomial, see S3 Appendix in S1 Text for details).