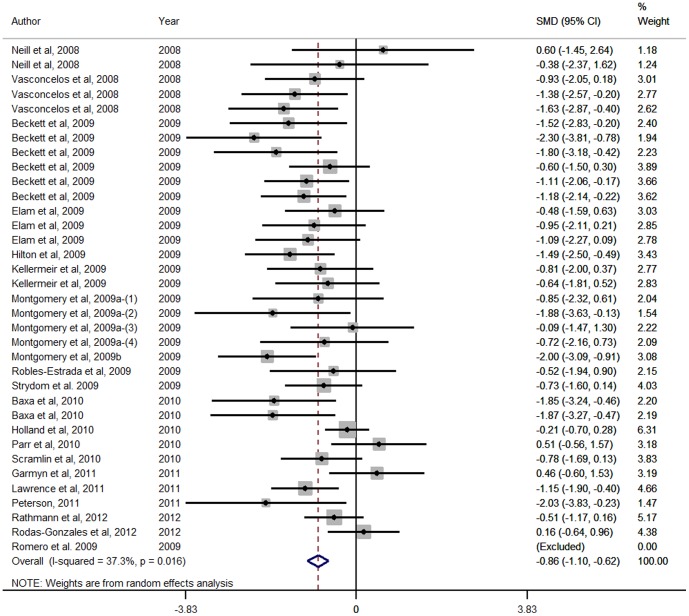
Figure 3. Forest plot of Standardised USDA marbling score responses for Zilpaterol studies.
A Forest plot of the effect size or standardized mean difference (standardized using the z-statistic) and 95% confidence interval of the effect of zilpaterol treatmenton USDA Marbling Score. The weights that each study contributed are in the right hand column and are indicated by the size of the box. The larger the box, the greater the study contribution to the overall estimate. The solid vertical grey line represents a mean difference of zero or no effect. Points to the left of the line represent a reduction in Standardised USDA marbling score, while points to the right of the line indicate an increase. The upper and lower limit of the line connected to the square represents the upper and lower 95% confidence interval for the effect size. The overall pooled effects size and 95% confidence interval is indicated by the diamond at the bottom. This effect was relatively homogenous as indicated by the I2 of 37.3%.

