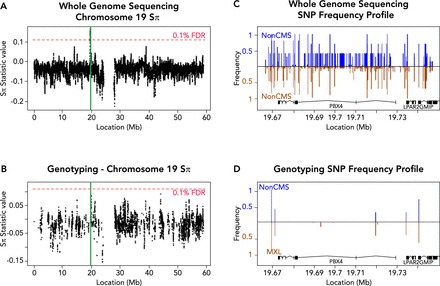
FIGURE 2.

The effects of sequence assay on genome-wide scans for selection
A and B: test statistic values on chromosome 19, when taking into account all variants discovered by WGS (A) or only the subset found in a common ∼1M SNP genotyping array (B) (1% FDR computed separately based on the genome-wide distribution of test statistic values). Highlighted in green is 1 of the 11 significant peaks reported in our laboratory's study (51), which does not exceed the 1% FDR using only genotype data. C and D: SNP frequency profiles of the highlighted (green) region in non-CMS (blue) compared with MXL (brown, inverted) showing all variants from WGS (C) or only the subset present in genotyping (D). WGS reveals many variants in the region, allowing a robust estimate of the allele frequency distribution, whereas genotyping detects only a handful of alleles, making inference of adaptive evolution difficult. However, genotyping studies in large populations can be used to validate the frequency differences obtained via WGS of smaller cohorts. Figure adapted from Zhou et al. (51), with permission from Elsevier.
