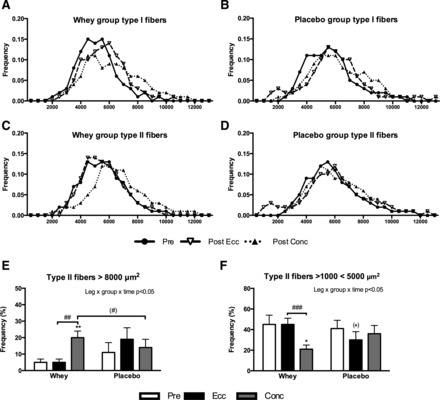
Fig. 5.

Fiber area frequency distribution shown as mean curves in type I (A and B) and type II (C and D) fibers or as percentage of “large” (>8,000 μm2) type II fibers (E) or “small” (> 1,000 < 5,000 μm2) type II fibers (F) evaluated from biopsies obtained pre and post 12 wk of eccentric (Ecc) or concentric (Conc) training combined with either whey protein (Whey) or isocaloric carbohydrate (Placebo) supplementation. A–D are presented as mean curves, and E and F are presented as means ± SE. Overall interactions are displayed in top right corner. Significant difference from pretraining are denoted by * (P < 0.05) or ** (P < 0.01) and tendencies by (*) (P < 0.1). Significant difference between groups are denoted by ## (P < 0.01) or ### (P < 0.001) and tendencies by (#) (P < 0.1).
