
Fig. 6.
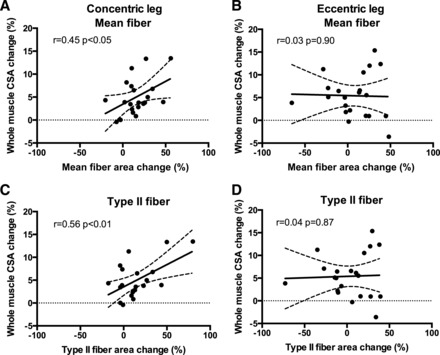
Correlations and scatterplots of relative changes in whole muscle cross-sectional area (CSA) and relative changes in mean (A and B) or type II (C and D) fiber CSA evaluated from magnetic resonance imaging and muscle biopsies obtained pre and post 12 wk of Eccentric (B and D) or Concentric (A + C) training combined with either whey protein or isocaloric carbohydrate supplementation (data are merged for supplementation). Dashed line denotes the 95% confidence intervals. Pearson correlation coefficients and significance are shown for each correlation.