
Fig. 1.
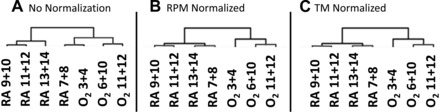
Normalization methods improved sample classification. Shown are the results of hierarchical clustering of all samples using 16,079 genes using Euclidean distance and average linkage. Samples were clustered using raw (A), reads per million bases (RPM, B)-, or trimmed mean (TM, C)-normalized data.