
FIG. 4.
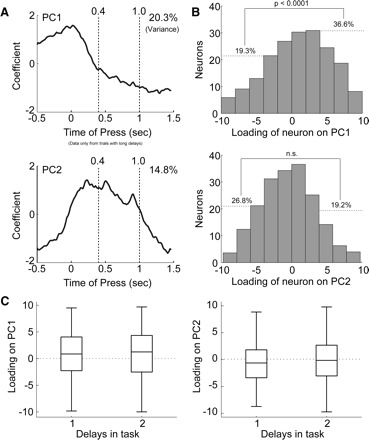
Analysis of firing patterns in dmPFC using principal component analysis (PCA). A: eigenvectors are shown for the first 2 principal components (PCs) relative to the time of lever press. The eigenvectors describe patterns of firing in the neuronal population. PC1 accounted for 20.3% of variance in the neuronal population. Eigenvectors for PC1 increased slightly at the lever press and then were negative during the delay period. PC2 accounted for 14.8% of variance in the neuronal population. Eigenvectors for PC2 increased around the lever press, were relatively constant during the delay period, and then were reduced during lever release. B: histograms of the loadings of neurons onto the PCs are shown. The loadings reflect the correlation between the neuron's firing pattern and the firing pattern described by the PC. More neurons had positive loadings on PC1 than had negative loadings (proportions test: χ2 = 13.1, df = 1, P < 0.0001); that is, more neurons “ramped down” than “ramped up” during the delay period (Fig. 5A). Loadings on PC2 were equally positive and negative. C: boxplots show that loadings on both PCs were equivalent for sessions with one- and two-delay periods. Note that all analyses are restricted to correct trials with a long delay.