
Fig. 3.
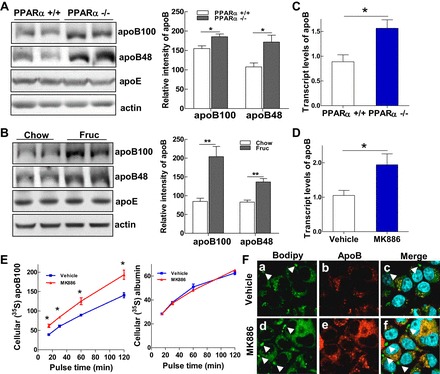
PPARα signaling transcriptionally regulates hepatic apoB synthesis. A and B: immunoblot analysis of apoB-100, apoB-48, apoE, and actin in liver homogenates of PPARα+/+ and PPARα−/− mice (A) and rats fed chow or fructose for 3 wk (B). C and D: relative mRNA expression of apoB detected by qRT-PCR in livers of PPARα+/+ and PPARα−/− mice (C) and McA cells treated with MK-886 (10 μM) for 48 h (D). E: McA cells (1 × 10⁶) were untreated or treated with MK-866 (10 μM) for 48 h. Cells were then deprived of methionine and cysteine for 1 h in the presence or absence of MK-866 (10 μM) and pulsed with 100 μCi/ml [35S]methionine for 15, 30, 60 and 120 min. Cell lysates were prepared, and cellular 35S-labeled apoB-100 was immunoprecipitated with an anti-apoB antibody, followed by immunoprecipitation of 35S-labeled albumin, with an anti-albumin antibody as control. F: McA cells were untreated or treated with MK-886 (10 μM) for 48 h and then stained for confocal imaging with anti-apoB antibody (red), BODIPY to visualize lipid droplets (green), and DAPI for nuclear staining (blue). Colocalization of apoB with lipid droplets is shown in yellow. For animal studies, results are shown as means ± SE (n = 5–6/group). For in vitro studies, data represent 3 experiments. *P < 0.05 and **P < 0.01 vs. controls.