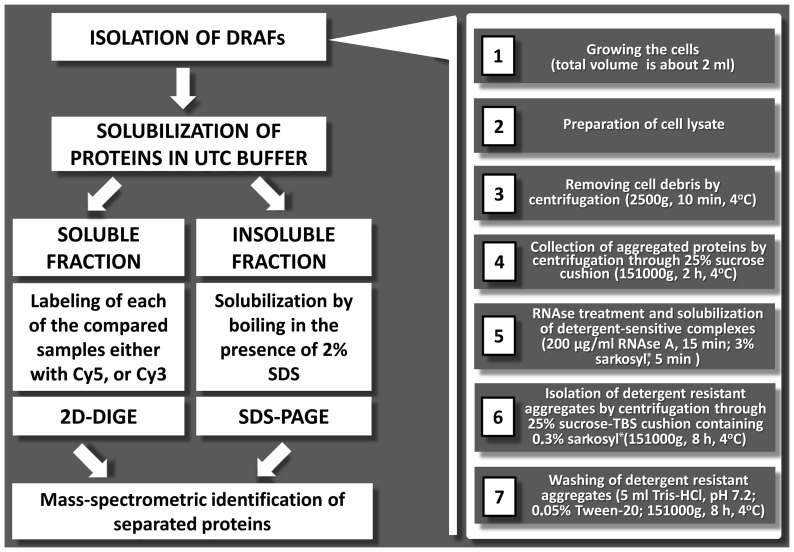
Figure 1. Schematic representation of PSIA.
Left panel illustrates the main stages of PSIA. Right panel describes the procedures for DRAF isolation. For details, see Materials and methods. *1% and 0.1% SDS can be used instead of 3% and 0.3% sarkosyl in steps 5 and 6, respectively.

